
Ui/Ux Design
Enapoint – Smart Energy Management Platform
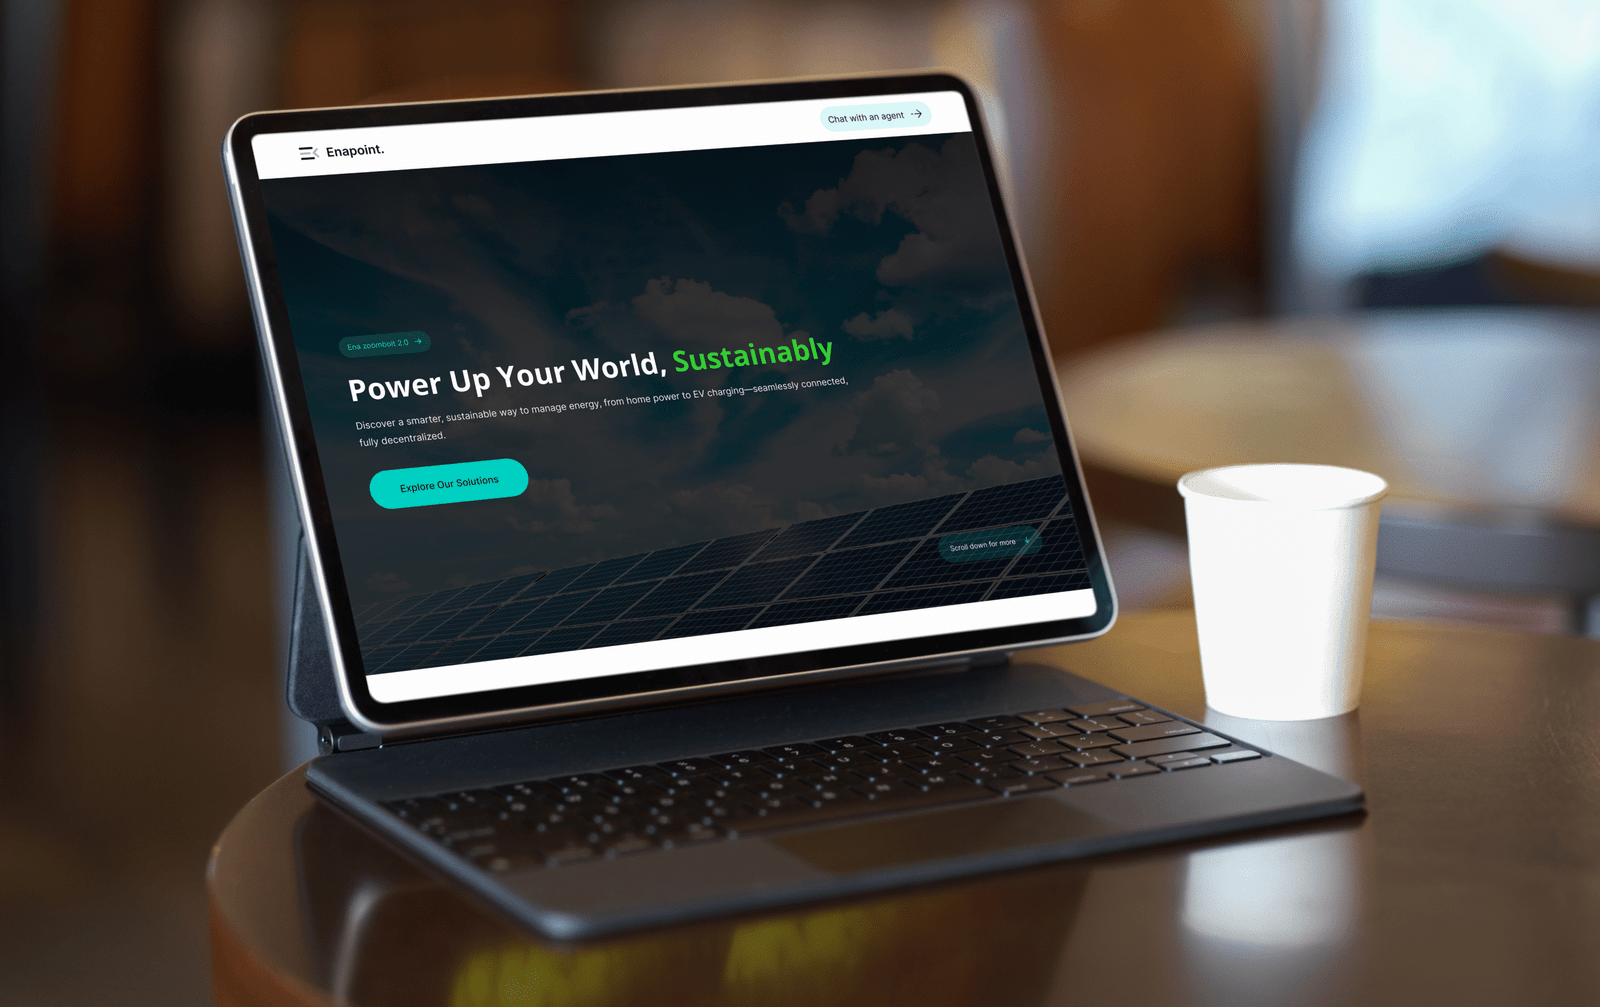
Enapoint is the command center for energy-conscious living. Created for ENA, this smart energy management platform gives users real-time visibility and control over their power usage. Whether you’re running a household or overseeing multiple commercial properties, Enapoint transforms raw data into actionable insights—empowering better, greener decisions.
Designed as a core component of the ENA ecosystem, Enapoint simplifies complex energy data through clean UI, intuitive dashboards, and seamless device integration.
Project Goals
ENA needed a platform that would:
- Provide real-time visibility into energy consumption
- Simplify how users manage and optimize their energy usage
- Work seamlessly across residential and commercial scales
- Translate complex metrics into digestible, actionable insights
- Align with ENA’s futuristic, sustainable brand identity
However, the challenge was crafting a data-rich experience that didn’t overwhelm users. Balancing clarity, technical depth, and visual elegance became the mission.
Turnover: December 2025 (3 weeks)
Tools Used: Figma, Miro, Notion
🔭 Design Process
From insights to interface, the process centered on simplifying complexity—transforming energy data into a human-centered digital experience that empowers users with clarity and control.
1. Discovery & Research
- Reviewed competing energy management tools
- Identified pain points around usability, onboarding, and technical overload
- Defined 3 primary user personas: Homeowners, Business Managers, and Energy Consultants
2. Information Architecture
- Structured the platform into digestible sections: Dashboard, Devices, Reports, Settings
- Prioritized real-time metrics and ease of navigation
3. Wireframing & Prototyping
- Created low-fidelity wireframes to validate layout and user flow
- Iterated with stakeholders using interactive Figma prototypes
4. Visual Design
- Applied a clean, futuristic theme using ENA’s color system
- Designed data cards, charts, and modular components for quick scalability
- Emphasized clarity with large legible typography, iconography, and white space
5. Developer Handoff
- Delivered clean design specs via Figma
- Collaborated with developers through Lark and Notion for feedback loops
⚠️ Challenges Faced
Building clarity from complexity wasn’t without friction—here’s where the friction points appeared, from abstract energy data to scaling UI systems, and how each obstacle fueled smarter design solutions.
Complex Data Structures
Translating technical energy data into user-friendly visuals without losing detail.
Multiple User Types
Designing a one-size-fits-most interface that served households and large-scale operations.
System Scalability
Building a UI that would scale with new features, IoT integrations, and user growth.
📈 Outcome
Enapoint launched as ENA’s core digital product—serving as a real-time control panel for smart energy users. It set the tone for future innovations within the ENA ecosystem and continues to drive energy efficiency, sustainability, and user empowerment.
- Reduced onboarding confusion by 60% via simplified flows
- Increased dashboard engagement thanks to modular insights and visual clarity
- Streamlined energy tracking for both individual and commercial users
- Delivered a scalable design system for future ENA integrations
